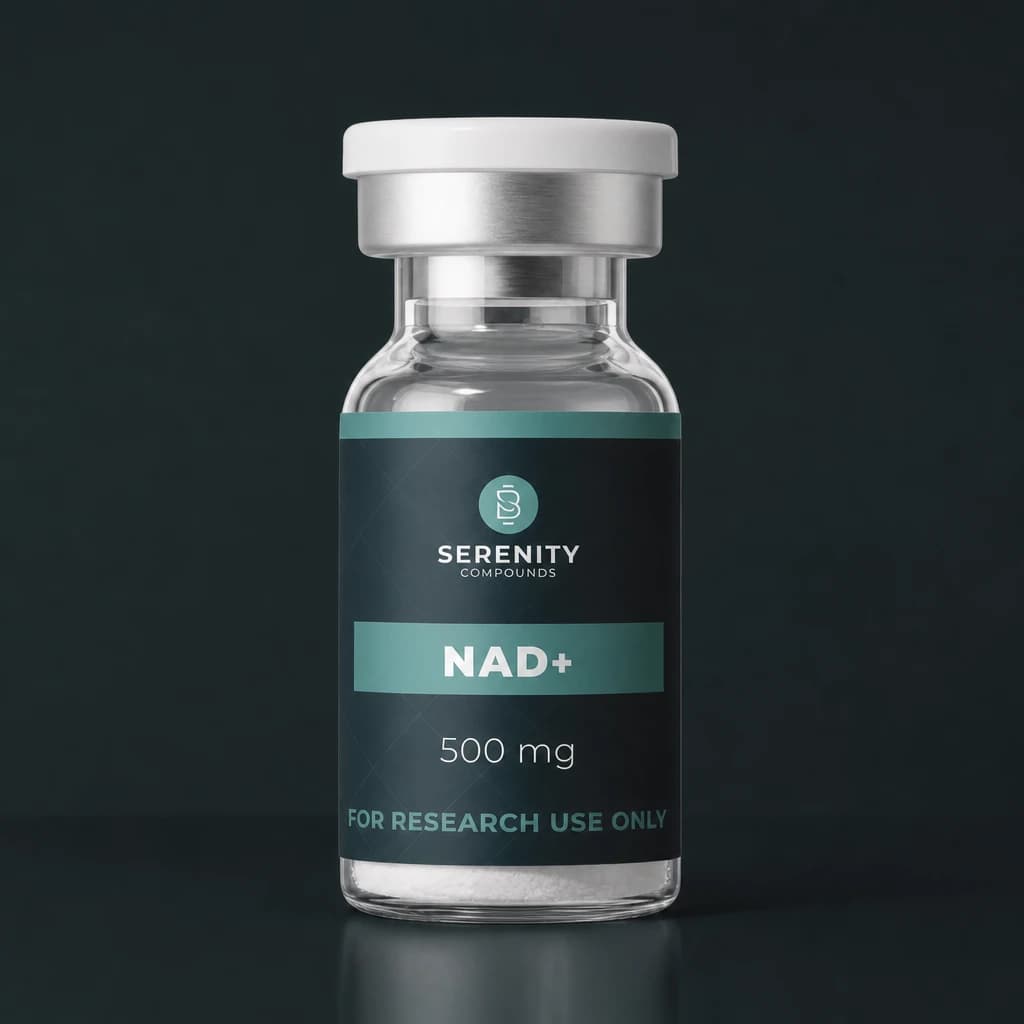
An NAD+ injection dosage chart does not become a validated human protocol because it contains precise numbers. Laboratory interpretation requires the chemical form and the experimental system behind those values. NAD+ concentration is also different from a measured NAD+/NADH ratio. This guide explains those distinctions without providing a personal infusion or injection schedule.
Which form and quantity does the chart describe?
The oxidized cofactor NAD+ and its reduced counterpart NADH have different analytical roles. A method should identify which species it measures. Total material mass may also include features of the supplied chemical form that affect conversion to molar concentration.
Serenity's NAD+ reference should be evaluated through its actual specification and lot documents. A general molecular formula from a secondary page may not describe the supplied salt or hydration state. The worksheet needs the applicable form before treating a molecular mass as an input.
How does mass concentration become molarity?
Molar concentration is amount of substance per volume. Converting mass to amount of substance requires division by the applicable molar mass. The units must remain consistent throughout the calculation. Milligrams cannot be treated as grams without the corresponding conversion.
For a hypothetical reference with a molar mass of 500 grams per mole, 0.5 grams per liter corresponds to 0.001 mole per liter, or 1 millimolar. Those arbitrary values demonstrate dimensional analysis only. They are not the specification of this product or a suggested experimental exposure.
Why does final assay volume matter?
Stock solution added to an assay is diluted by the rest of the mixture. The concentration in the well or reaction vessel therefore differs from the stock concentration unless the method explicitly preserves it. Our calculator explanation follows a stock through this final dilution step.
Is the NAD+/NADH ratio a dose readout?
No. The ratio compares two measured species under the method's sampling and extraction conditions. It does not report how much material was originally added. Changes can reflect metabolism or analytical handling as well as the experimental intervention.
Sample processing can affect redox measurements. A method needs to explain how the relevant species were preserved and distinguished. Reporting a ratio without that context may hide uncertainty that matters more than another decimal place in the result.
What does human infusion literature establish?
A small plasma and urine metabolome pilot examined observations during an NAD+ infusion. It was not a broad efficacy trial establishing rejuvenation or general wellness benefits. Its defined study preparation also does not characterize a research supplier's vial.
Clinical observation and a laboratory enzyme assay answer different questions. Our NAD evidence overview separates endogenous cofactor biology from claims attached to commercial administration. Neither evidence type should be rewritten as a universal schedule.
Which chart errors deserve an immediate review?
Mixing mass units and volume units without labels is a basic problem. Treating a nominal vial amount as analytically measured content creates another. A table should also state whether an exposure is a stock value or the final value in the experimental system.
Before and after language can conceal a different mistake: assuming that a change in a biochemical marker establishes a functional health improvement. The endpoint needs to be named precisely. A redox measurement alone cannot supply a conclusion about energy, cognition or aging.
NAD injection charts and the difference between amount and rate
Rate describes an amount delivered or transformed per unit of time. It is not the same quantity as total amount. A publication may use both, and the duration is needed to relate them under a defined design. Removing the time unit from a rate changes its meaning. A laboratory evidence table should retain the original quantity instead of treating every numerical entry as a dose.
Reaction rates introduce another distinction. An enzyme assay may report substrate conversion over time, while a clinical study reports the rate of introducing a preparation. Those values describe different processes. Their units can appear similar without being interchangeable. The worksheet should identify the physical event being measured so that a mathematical resemblance does not become an unsupported biological comparison.
NAD+ injections before and after versus a redox ratio
Ratios need both underlying values to be interpretable. In a hypothetical assay, oxidized and reduced quantities of 8 and 2 give a ratio of 4. Quantities of 4 and 1 give the same ratio even though the combined amount is half as large. Reporting only the ratio would conceal that difference. These arbitrary numbers illustrate why a ratio cannot substitute for measurements of the individual pools.
Normalization can create further ambiguity. Values reported per cell, per mass of tissue or per amount of protein use different denominators. A change in the denominator can affect the reported result even if the total measured analyte does not change proportionally. The analysis should state its normalization basis and explain why that basis fits the experimental question.
Building a peptide concentration calculator worksheet for a nonpeptide
Cofactor chemistry does not prevent ordinary concentration arithmetic, but it does require the correct inputs. NAD+ is not a peptide, so a tool's category name should not determine its molecular mass or material form. Use the documented specification rather than a peptide default. The calculation remains valid only if the units and applicable chemical basis are entered consistently.
Salt and hydration information may affect the relationship between weighed material and amount of the target species. A content assay can provide a different basis from gross mass. Record which basis the worksheet uses and avoid applying multiple corrections for the same contribution. An unexplained adjustment can be as misleading as omitting a necessary one, especially when another analyst tries to reconstruct the calculation.
Final assay values and calibration checks
Calibration standards and experimental exposures have different purposes. A standard helps establish the relationship between analytical signal and known quantity. An exposure condition investigates a response to material in the model. Confusing those roles can make a valid analytical concentration appear to be a recommended biological concentration. Label them separately even if the same stock reference supplies both.
Blanks help reveal signal from reagents or the sample matrix. A calibration prepared in one background may not behave identically to an extracted biological sample. The analytical method should address that difference when it matters. Correct dilution arithmetic cannot determine whether the signal reflects the intended species or a matrix effect that changes the measurement.
Storage records for oxidized and reduced species
Extraction and handling need to preserve the property being measured. If the aim is a redox comparison, sample preparation should be evaluated for changes that could occur outside the biological system. A reported ratio can otherwise include processing effects. The record should identify the method and interval between collection and analysis rather than treating the instrument result as independent of sample history.
Stability evidence also needs to distinguish the reference stock from the extracted sample. Their matrices and intended measurements can differ. A statement supporting one preparation cannot automatically establish the other. Retain the relevant supporting conditions and any measured recovery result beside the nominal concentration so the analytical history remains visible when results are compared.
What are NAD injections?
Here the search term refers to administration of an NAD+ preparation, but the cited human pilot examined a particular infusion and metabolome measurements. It does not define every product or route discussed online. In this laboratory guide, the phrase is used to examine why quantities from that literature cannot become a universal schedule for independently supplied research material.
How much NAD+ should I inject?
Neither the concentration formulas nor the pilot establish a personal amount. A clinically appropriate decision requires evidence and qualified care beyond the scope of a research worksheet. The useful role of this guide is to identify what a number represents and what remains unsupported. A precise answer from a calculator cannot resolve the missing clinical and formulation questions.
What belongs in a useful laboratory worksheet?
Record the material form and source of each input, then retain the calculation through the final assay concentration. Keep measured redox results in their own fields with the analytical method. That structure supports reproducibility without converting a research chart into personal administration guidance.